
Do you wish you could run reports on your JSCAPE MFT Server based on specific search results that were previously created on the Logging module? This capability can be particularly useful during audits or investigations, when you would like to get finer levels of reporting regarding your file transfers.
When you go to the Reports module and add a report, you’re allowed to choose from a variety of built-in metrics like Top Users, Top Hosts, Top Uploads, Top Downloads, Monthly Statistics, and so on. However, if you just go ahead and click OK, the data used will come from all the records in the logs. As a result, the information you get can be too broad.
What if you wanted to know the Top Uploads or Monthly Statistics of file transfers involving only image files? This kind of reporting would entail the use of regular expressions to match certain values in the server message column of the logs.
If you’ve already familiar with the Logging module, you’ll notice that this is the kind of criteria you would enter into that module’s Search tab.
Basically, to start, you would typically specify a Date Range and then employ a regular expression similar to this against the Server Message column:
.*\.jpg.*|.*\.bmp.*|.*\.png.*
(Note: If you’re not yet familiar with regular expressions, this introductory article to regular expressions is a good place to start.)
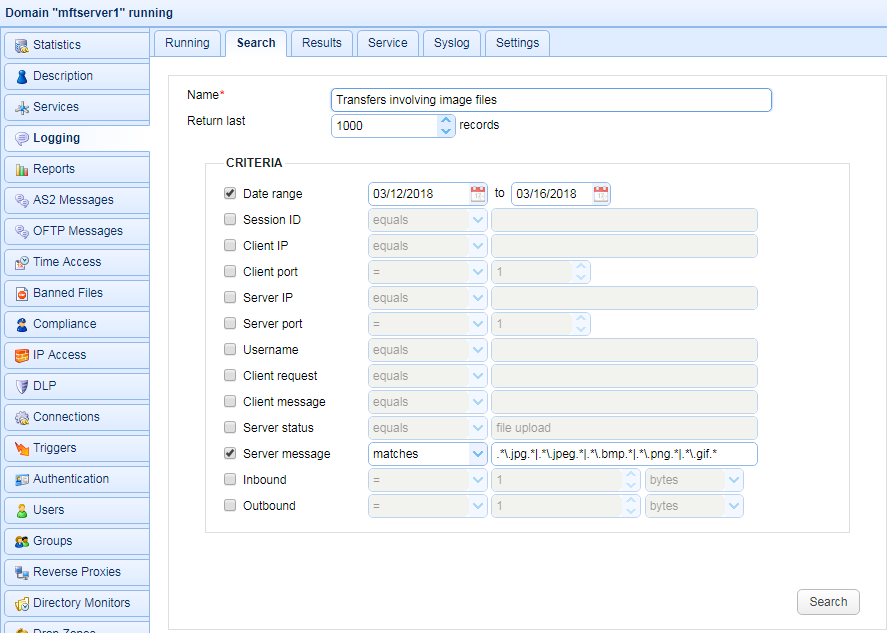
Once the Search is run, the managed file transfer server would gather all records in the logs where a .jpg, .bmp, .png, etc. can be found in the Server Message column.
The results would then be made available in the Results tab.
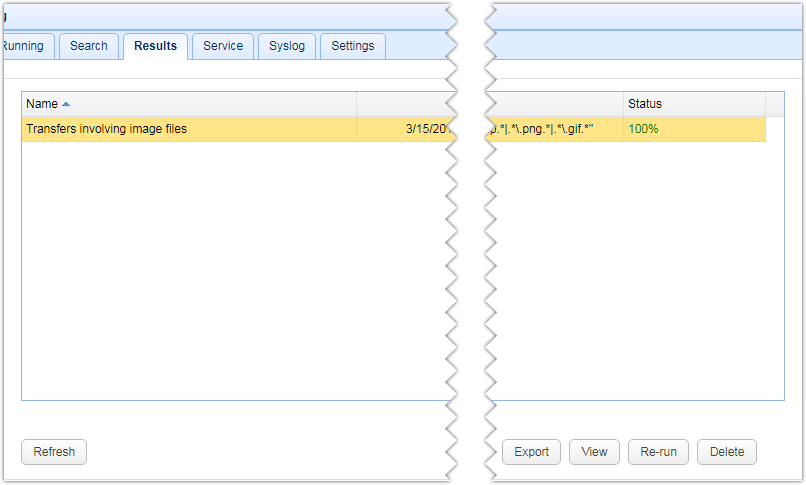
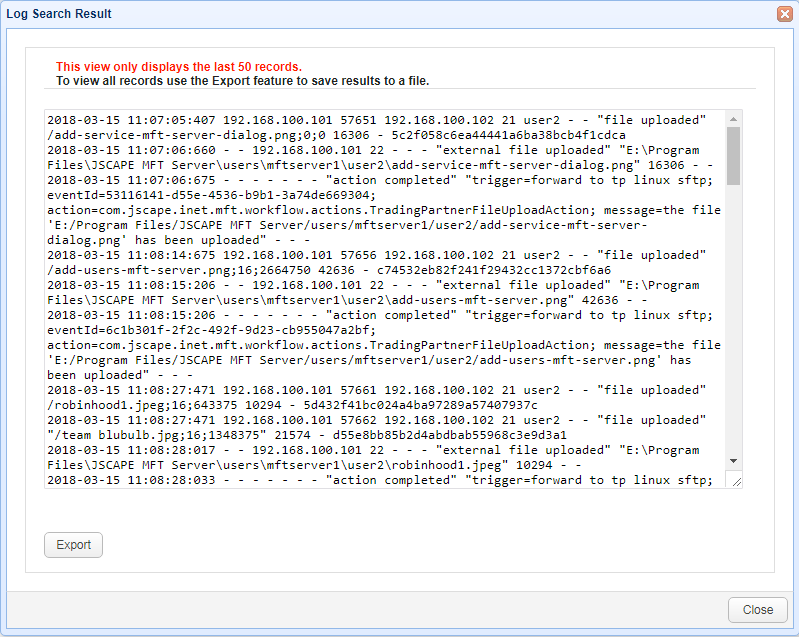
From there, you could view the results by clicking on the View button.
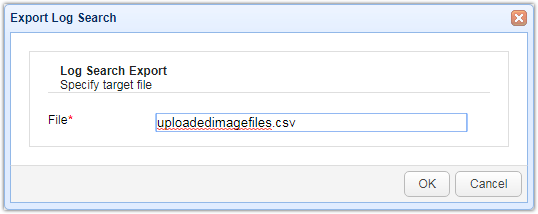
Or you could Export it to a file by clicking the Export button. I usually export the results as .csv files for easier viewing on a spreadsheet application like MS Excel or OpenOffice Calc.
Here’s a sample export viewed through OpenOffice Calc.
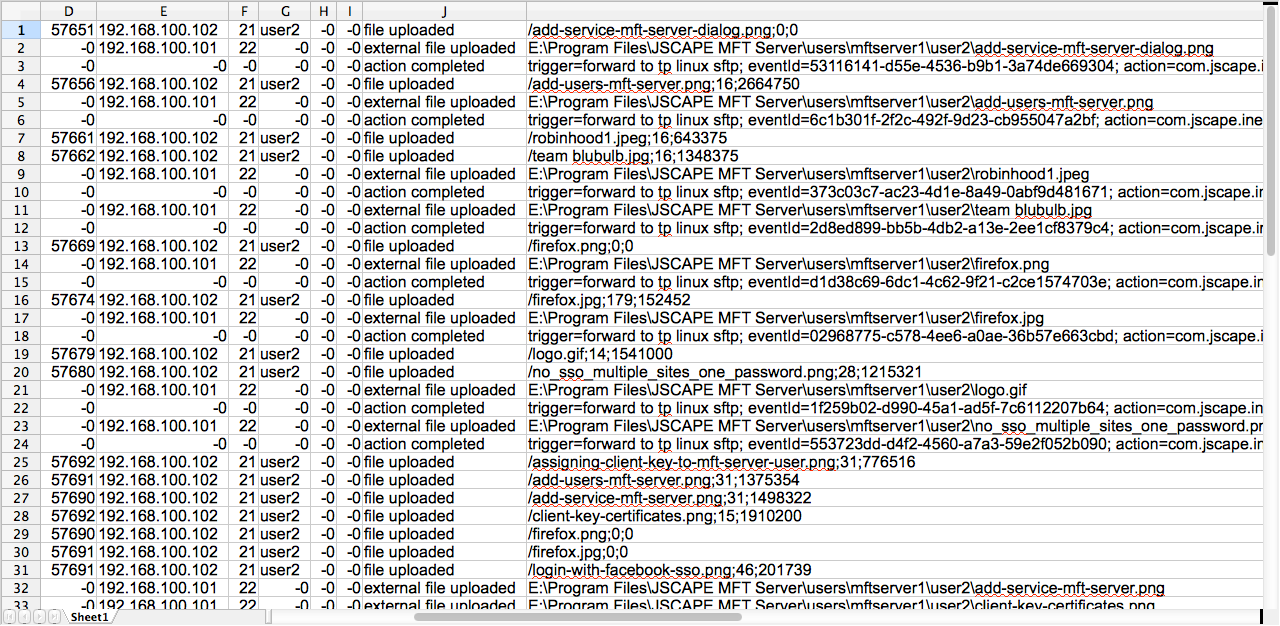
While a spreadsheet like this can give you all the information you need, it’s going to take a lot of slicing and dicing before you can get any actionable, insightful information. A better, faster option would be to view those log results in a report generated by JSCAPE MFT Server itself. Let’s do that now.
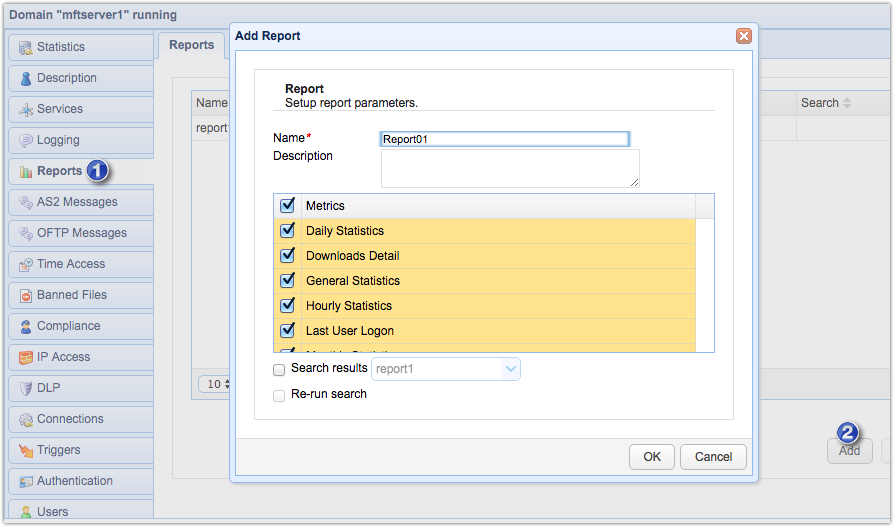
Go back to the Reports module and add a new report. When the Add Report dialog appears, tick the Search results checkbox and then select the name of the search result you created from the drop-down list.
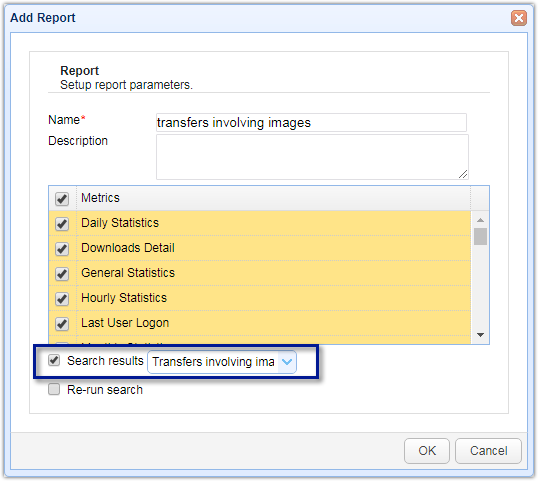
When you run this report, the metrics obtained will be taken specifically from that particular search result. You can even re-run the search to make sure recent records will be included.
Here are a few tables and graphs we grabbed from this particular report.
One of the tables you’ll find in your reports feature hourly statistics such as Total Bytes, Average Bytes, and Average Throughput. There’s one set for uploads and another for downloads. What you’re seeing below is a cropped screenshot of that table. The Downloads statistics are hidden from view.
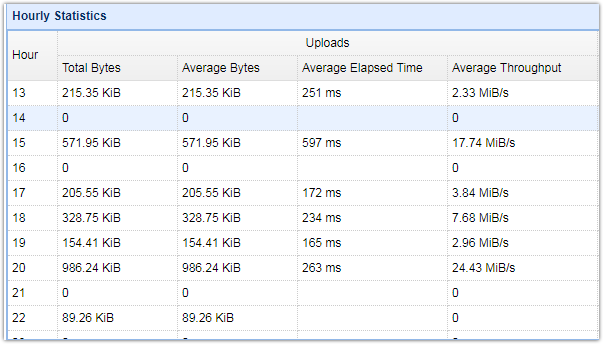
You can likewise view a graphical representation of certain hourly statistics such as Uploads, Average Uploads, Downloads, and Average Downloads, with the option (using toggle buttons) to restrict the view to either uploads or downloads.

Note that what we’ve shown above are for hourly statistics. A separate set of tables and graphs showing similar statistics for daily and monthly periods are also available.
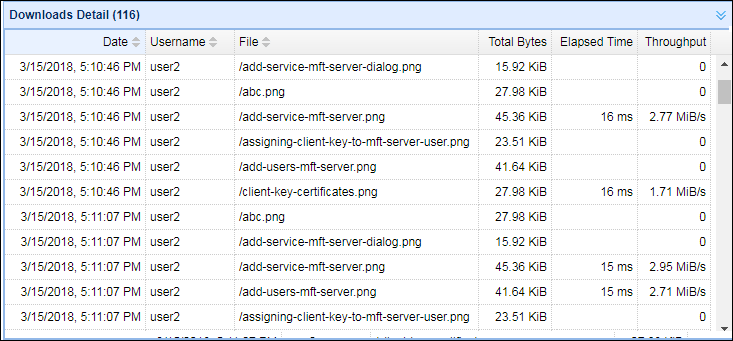
If you want to inspect each individual file transfer, you can view the Downloads Detail or Uploads Detail table, which shows pertinent information of each download or upload such as date/time, username (of the account who carried out the download/upload), the filename, total bytes, time elapsed, and throughput. The screenshot below is only for the Downloads Detail table.
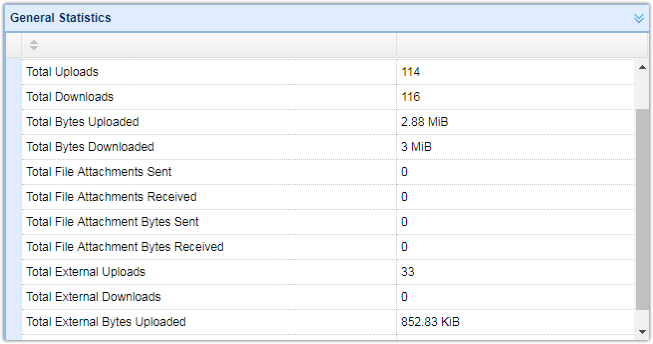
On the other hand, if what you want is an overview of the file transfers performed in the specified date range, you can view the General Statistics table, which contains aggregate values for the following statistics:
- Total Sessions
- Total Unique IPs
- Total Uploads
- Total Downloads
- Total Bytes Uploaded
- Total Bytes Downloaded
- Total File Attachments Sent
- Total File Attachments Received
- Total File Attachment Bytes Sent
- Total File Attachment Bytes Received
- Total External Uploads (for uploads carried out using triggers)
- Total External Downloads (for downloads carried out using triggers)
- Total External Bytes Uploaded
- Total External Bytes Downloaded
Here’s a sample screenshot of that table:
Other tables and graphs included in the report are the:
- Top Email Attachment Sent,
- Top Downloads, Top Uploads,
- Top Errors,
- Top External Downloads,
- Top External Uploads,
- Top Hosts,
- Top Users, and
- User Detail (which contain pertinent information of each user, including: total number of sessions, last login, number of files uploaded/downloaded, and total bytes uploaded/downloaded.
If you’d like to see how all these look like yourself, download the free, fully-functional JSCAPE MFT Server Starter Edition, try doing some file transfers, and then run your reports.
Download JSCAPE MFT Server Trial