This custom trigger function helps to get the used heap in MB on run time. This custom function helps to get the statistics during too many user uploads/downloads or during trigger execution. The real use of the function comes when the servers responds slow.
Downloads
Source code and build instructions
How to get the used heap using GetUsedHeapInMb Function
Let me now show you how to implement that.
1. Create a Trigger to get the statistics of the Used Heap
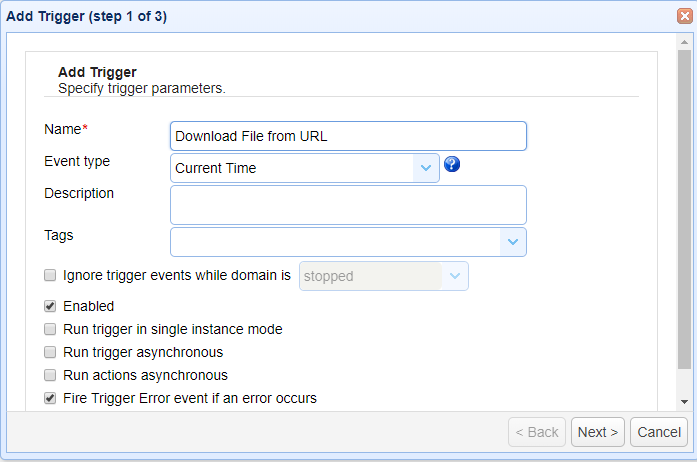
Login into admin console of JSCAPE MFT Server > Triggers and Click Add to create a Trigger
Give the trigger aNameand then select theCurrent Timeevent type from the drop-down list.
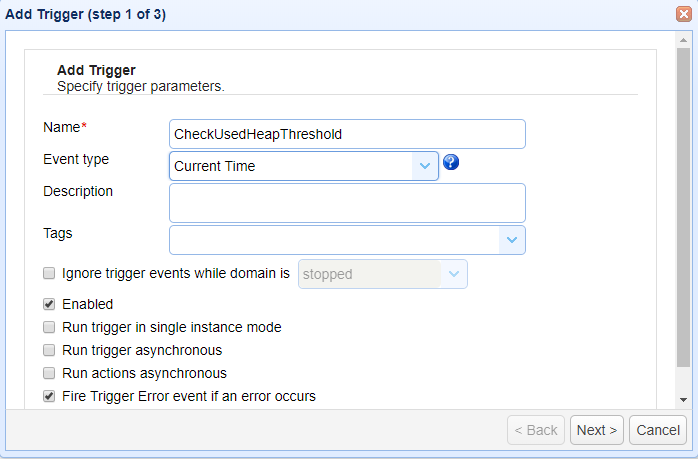
ClickNextto Step 2 where a condition can be set to execute the trigger.
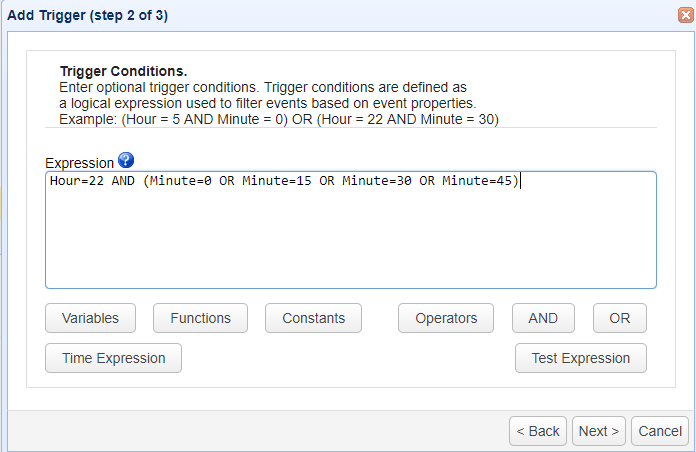
Consider an example that the Jscape Server is too busy (from 22 Hours to 23 Hours) in processing the tasks on a specific time in a day. The slowness of the server can be due to excess heap usage (one of the reason for slowness).
In order to debug and know about the heap statistics we need to get the heap usage. Hence in the expression add the condition to be as;
Hour=22 AND (Minute=0 OR Minute=15 OR Minute=30 OR Minute=45)
The above expression indicates that the used heap value should be logged from 22 Hours to 23 Hours scheduled with a interval of 15 minutes.
Once the condition is set ClickNextto proceed
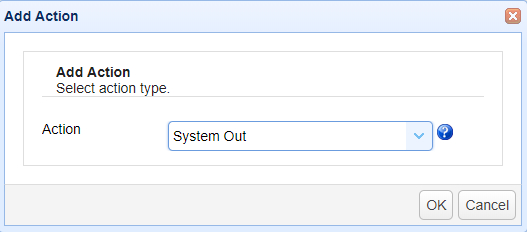
The step 3 asks to add an action, Add the action “System Out” from drop down list, to print the statistics to the domain logs
Click OK to proceed
The Parameters for the action “System Out” is;
- Message
As the name indicates, Messageis where you want the server to log.
Along with custom message use the GetUsedHeapinMb function to log the used heap allocated. In order to use the function , Click the Functions button and select the GetUsedHeapinMb function. If the function is not listed checkout whether the build (Source code and build instructions)is available
For example as below;
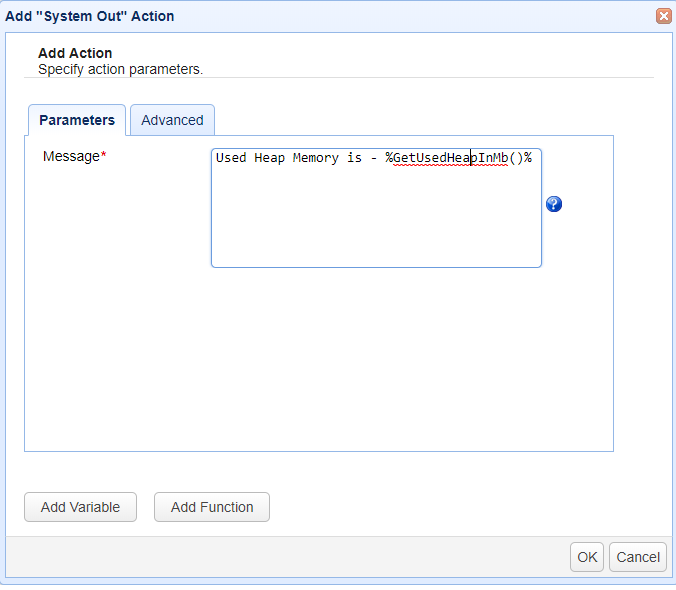
ClickOK to save the settings
That’s it. Now you know how to create a trigger to log the used heap of Jscape MFT Server.

